In an electrical circuit, it is the connections between components that determine what the circuit can do. When driving from one city to another, you need to know not only the roads that you will take, but where these roads connect. The human brain contains some 85 billion neurons, and these neurons communicate through well over 100 trillion connections, or synapses. If we want to begin to understand how networks of neurons process information and generate all of our varied and complex behaviours, then clearly an essential prerequisite is to know how the network is wired up – which neurons are connected to one another, and how strongly. Doubtless you have heard of the genome – the full complement of genes in your DNA – and perhaps even the microbiome – all of the microorganisms that live and grow in and on your body. Well, in this vein, the complete set of connections between single neurons is known as the ‘connectome’, and neuroscientists are currently investing a lot of effort into unravelling this tangled web of connectivity, as an early step into understanding how the brain performs all of its amazing feats.
Traditionally, two main approaches have been used to analyse single connections within the nervous system. The first uses recordings of the electrical activity of neurons: stimulate one neuron, and record whether this leads to a response in another neuron. The delay

An electrical current is injected into the ‘layer VI’ neuron, and a response is recorded in the ‘nRT’ neuron. From Gentet & Ulrich, 2004.
between the stimulation and the response indicates whether this is a direct (monosynaptic = one synapse) or an indirect (polysynaptic) connection; alternatively, there are several ways to prevent polysynaptic transmission, so that only direct connections remain. This approach also allows us to measure the strength of the connections. However, there are several limitations to this method: first, each recording measures only a single connection, so looking at even a small fraction of the connections in the brain would require a huge effort. Secondly, it is often impossible to record from identified neurons in intact brains, particularly in vertebrates, so brain slice preparations are used instead – but these slices sever many of the very connections we are trying to uncover.
Part of a neuron seen by electron microscopy. Synapses indicated by arrows.
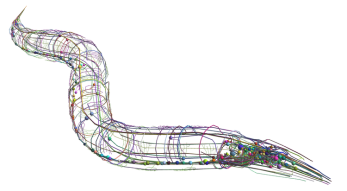
The reconstructed C elegans connectome.
The other traditional approach to the connectome is electron microsopy. This is a form of microscopy that uses electrons in the place of light, allowing us to see structures on a scale smaller than a single cell, which would be indistinguishable to a light microscope. By taking a series of images at successive levels of brain tissue, we can trace the course of a neuron through the brain, and see every synapse that it makes along the way. The synaptic strength can be roughly estimated from the amount of transmitter stored therein.
In fact, we already have the full wiring diagram for one species – the nematode worm C. elegans. This worm has only 302 neurons, and around 7000 synapses, but even so this connectome required a monumental effort, due to the sheer amount of time required to prepare each micrograph and to reconstruct a series of them into a 3D picture. Therefore, scaling up these techniques to more complex nervous systems – even those of flies or fish – is simply not practical. For these reasons, neuroscientists have recently been racking their brains to come up with new approaches to the connectome.
Several of these novel approaches use light microscopy. Just looking at neurons through a light microscope can only tell us whether two neurons are within close proximity, but not whether they make a connection. However, GRASP technology can overcome this limitation. Green Fluorescent Protein, or GFP, is a molecule naturally produced by jellyfish that fluoresces brightly in green when illuminated with blue light. Since expression of GFP can be genetically targeted to specific cell types, it is widely employed in biology as a label. With GRASP, the GFP molecule is split in two, and each half of the molecule is targeted to one of the neurons of interest. Fluorescence is only seen when the two halves come together – which only happens when the cells come into very close contact, as at a synapse. But there is a limit to how specifically neurons can be genetically labelled, and so not all possible pairs of neurons can be studied using GRASP.
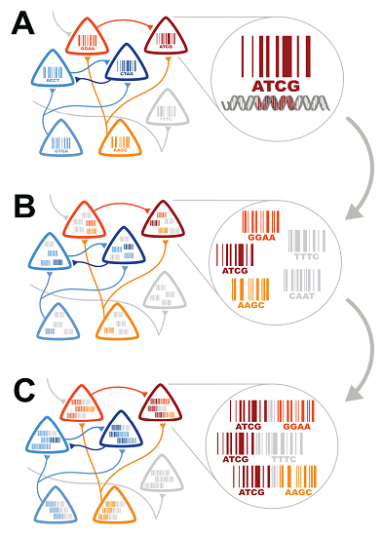
The three steps of sequencing the connectome. From Zabor et al, 2012.
In a recent issue of PLoS Biology, Zabor et al a new approach that they believe could revolutionise the study of connectomics. This approach relies on recent advances in DNA sequencing technology: a DNA sequence of one million As, Cs, Ts and Gs, which would have cost over US$5000 to sequence just ten years ago, would now cost less than 50¢. Their concept is composed of three components. First, each neuron is individually labelled by a short DNA sequence – its unique ‘barcode’. Next, the DNA barcodes of directly connected neurons must be associated with one another. One way to do this could employ viruses that can package the DNA barcode of a ‘donor’ cell, and travel to directly connected ‘recipient’ cells, taking the barcode with them. Thus each neuron would contain its own barcode, plus those of directly connected neurons. The final step is to connect all of the barcodes within each neuron together into a single piece of DNA. Then, all that’s left is to read the sequences of all of these pieces. If two barcodes are found together on the same piece of DNA, then the neurons identified by these barcodes must be connected. Sequencing these pieces from every neuron in the brain would give us a complete picture of which neurons are connected to one another.
There are, of course, limitations to this approach. For one thing, it would not allow us to measure the strength of the connections, or whether they are excitatory or inhibitory. Also, we would not obtain any spatial information regarding the layout of neurons, which is important because the shape and size of a neuron affects its electrical properties. Nevertheless, this approach is promising, partly because it would identify long- and short-range connections equally well, whereas conventional methods are very poor at tracing long-range connections.
Hurdles remain to be overcome before the sequencing approach to the connectome sees the light of day – how to get these barcodes into every neuron, how to couple connected barcodes and how to join these barcodes together. Still, this idea has generated a lot of interest amongst neuroscientists, not least because it offers the possibility of characterising the connectomes of animals in very short times and for a very small cost – something that will be essential to understand the complex interactions between the web of neurons that generates all of our thoughts and actions. But of course, as C. elegans has shown us, even knowing all of an animal’s neurons and all of their connections will not tell us how the nervous system works. For this, we need to know the properties of every neuron and of every connection, and the information coming into the system. Clearly, understanding how brains work is going to be a long, hard problem to crack. But it’s new ideas like “sequencing the connectome” these that will help us on our way.
Gentet LJ & Ulrich D (2004). Electrophysiological characterization of synaptic connections. Eur J Neurosci 19(3), 625-33.
Zador AM, Dubnau J, Oyibo HK, Zhan H, Cao G & Peikon ID (2012). Sequencing the Connectome. PLoS Biol10, e1001411.
